Reading: BCG Matrix
Purpose
When a company offers a wide range of products or operates in multiple lines of business, strategic decision-making becomes more complex. The organization must conduct a situation analysis for each business unit and determine where to focus its resources. To support these decisions, the Boston Consulting Group developed the BCG Matrix (also called the Growth-Share Matrix) in 1970. This tool helps companies identify which products or business units warrant continued investment and which may be phased out.
The BCG Matrix evaluates each product or business based on two key dimensions:
- What is the current market share?
- What is the market’s growth potential?
Market Share
Market share refers to the percentage of total sales in a market accounted for by a specific product or company. It can be calculated using either units sold or revenue generated. For example, imagine your lemonade stand sells 200 glasses of lemonade each summer, and there are two competitors selling 50 and 150 glasses respectively. Out of 400 total glasses sold, your share is 50 percent.
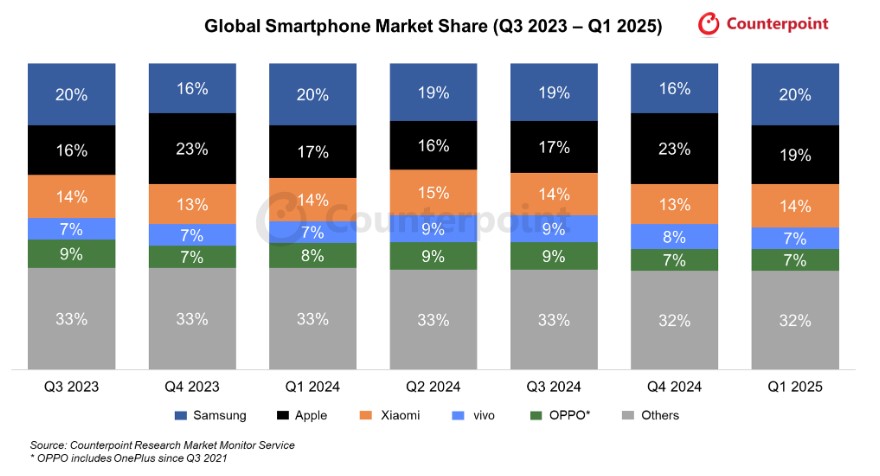
Companies closely monitor market share to assess their competitive position and inform strategic decisions. In the global smartphone market, Android and iOS continue to dominate the landscape, but recent trends show important regional and brand-level shifts.
In Q1 2025, global smartphone shipments grew by 2% year-over-year, with much of the growth driven by emerging markets. The Asia-Pacific region accounted for more than half of global shipments, while Japan stood out with a 29% increase—largely due to rising demand for Apple and Samsung devices. North America also recorded strong growth, with an 8% year-over-year increase, as manufacturers accelerated shipments to reduce exposure to rising tariffs.
Samsung led the market with a 20% global share, followed closely by Apple at 19%. The recent launches of the Galaxy S25 and iPhone 16e fueled sales momentum. Apple experienced the fastest growth among the top five brands, posting a 12% increase in shipments, bolstered by strong performance in North America, Japan, and India. Xiaomi held third place, with a 2% growth year-over-year, while vivo and OPPO ranked fourth and fifth, respectively, driven by success in the mid-tier market and government subsidies in China.
While these results reflect short-term gains, industry analysts caution that the global market may soften later in 2025 due to shifting consumer sentiment and continued macroeconomic uncertainty, including tariffs and supply chain pressures.[1]
Market-Growth Potential
Market growth potential is more difficult to measure but is equally important. It reflects the anticipated expansion or contraction of a market. For example, Procter & Gamble markets a wide range of products, including bathroom tissue. This category sees minimal growth, largely tied to population trends. In contrast, the market for high-end skincare products—especially those appealing to aging baby boomers—continues to grow as this generation remains active with disposable income.
Growth potential is typically based on industry trends, demographic data, and consumer behavior. Though somewhat speculative, it provides valuable insight into the likely trajectory of a market.
Applying the BCG Matrix
 The BCG Matrix classifies products or business units into four categories, based on high or low market share and high or low market growth. Each quadrant serves a specific strategic purpose.
Dog
A dog is a product or business with low market share in a mature or declining industry. Since growth is limited, further investment is usually not recommended.
Cash Cow
A cash cow has high market share in a slow-growth industry. It generates more revenue than is needed for maintenance, making it a reliable source of funding for other areas of the business. However, it requires minimal reinvestment.
Question Mark
A question mark represents a product with low market share in a high-growth industry. It is uncertain whether it will succeed. These products require close attention, as they could evolve into either stars or dogs depending on market response and strategic action.
Star
A star has both high market share and strong market growth. These products are typically profitable and have the potential to become cash cows as growth stabilizes. Stars are ideal targets for continued investment.
Strategic Value of the BCG Matrix
The BCG Matrix supports portfolio management by guiding investment toward the most promising areas of the business. Over time, as industries mature, products will naturally transition into either cash cows or dogs. The matrix encourages companies to maximize returns by investing in stars and potential stars, while minimizing exposure to low-performing areas. This strategic balance helps fund future growth and sustain long-term success.
Creation note: This content was drafted with the assistance of ChatGPT, a language model developed by OpenAI, and was subsequently reviewed and edited by the author for clarity and accuracy.
- Counterpoint Research. (2025, May). Global smartphone shipments grow 2% YoY in Q1 2025 as Samsung and Apple lead recovery. Retrieved from https://www.counterpointresearch.com/ ↵
